How much stock to buy before Black Friday (without trapping your cash)
A worked method for Black Friday stock: coverage until the next delivery, a peak-week multiplier, safety stock — and which slow sellers to clear instead of reorder.

There are two ways to get Black Friday stock wrong, and small shops usually manage both at once. The bestseller sells out on Saturday morning and stays out until January. Meanwhile the shelves are full of the products nobody wanted in September either — and the cash that could have bought more of the bestseller is sitting in them.
The fix is not a better forecast. It is a simple sum done per product, plus one honest look at what is not selling.
Step 1: how long must this order last?
The question is not “how much will I sell on Black Friday” but “how much will I sell until the next delivery can arrive”. If your supplier needs 30 days and you place the order on 20 November, nothing new lands before 20 December. Everything you sell from today until then has to come from what you have plus what you order now.
Split that window into three parts, because the sales rate is different in each:
- before the peak — normal days, 1 to 26 November;
- the peak — Black Friday to Cyber Monday, plus the days around it (call it 8 days);
- after the peak — the December gifting weeks until the delivery lands.
Step 2: a sales rate for each part
Take the average daily units from the last 4–6 normal weeks. For the peak, multiply by what last year’s peak did compared with the weeks before it; if you have no history, 2–3× is a reasonable planning range for a shop that runs a sale and emails its list. For December, most gift-friendly products sell somewhere between normal and peak.
Worked example — a product with a landed cost of $11 that sells 6 a day in a normal week:
| Window | Days | Units / day | Units |
|---|---|---|---|
| 1–26 Nov | 26 | 6 | 156 |
| Peak week | 8 | 15 | 120 |
| 3–20 Dec | 18 | 8 | 144 |
| Total demand | 420 |
Step 3: safety stock, then the order
Demand is a guess, so add a buffer. A simple one that works: a week of the busiest normal rate — here 7 × 8 = 56 units. Needed in total: 476. With 150 on hand, the order is 326 units, or 326 × $11 = $3,586 of cash leaving the business in November.
That last number is the one to check before you press “order”. Put it into your cash forecast next to the ad budget for the peak and the rent for January. If the lowest balance in the next 13 weeks drops below one month of fixed costs, cut the order for the products with the thinnest margin first — not evenly across everything.
Step 4: find the sleepers before you buy anything
Now the other half. For every product, divide units on hand by average daily sales:
Days of stock = units on hand ÷ units sold per day
Anything above 90 days is a sleeper. Say you hold 240 units of a product that sells 0.8 a day: 300 days of stock, and 240 × $11 = $2,640 of cash that will not come back before next summer.
Sleepers are what the Black Friday discount is for. Put the deep discount on them, not on the bestseller that would have sold anyway — you clear cash that was stuck, instead of giving margin away on units you could have sold at full price. And do not reorder a sleeper because it is “a classic”: the days-of-stock number is the classic.
Step 5: three lists, one decision each
At the end you should have every product in one of three lists:
- Reorder — days of stock below the window to the next delivery; order the gap plus safety stock.
- Hold — enough stock to cover the window; no order, no deep discount.
- Clear — days of stock above 90; the sale discount goes here, and no reorder.
It takes an evening with a spreadsheet, and it changes the shape of the whole quarter: fewer stock-outs on the products that sell, less cash on the shelf in January.
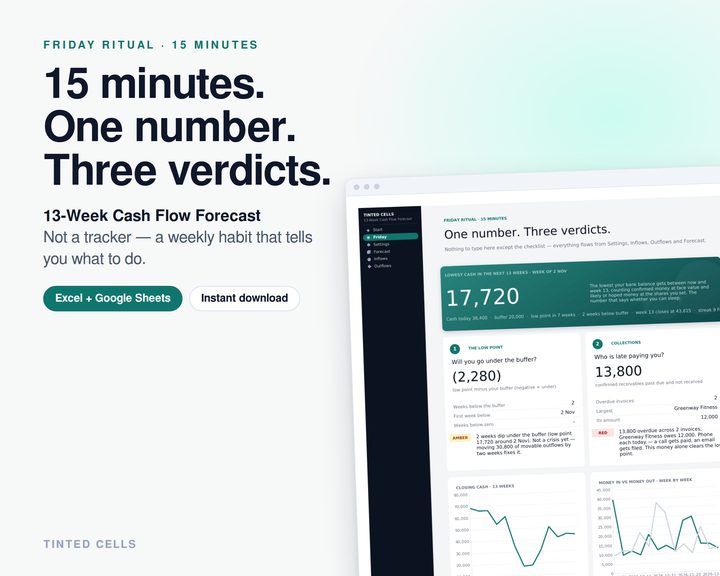
The Inventory Capital & Reorder Planner keeps this as a weekly habit: capital tied up per SKU, days of stock, a reorder point and quantity from your lead times, and a sleepers list with the cash each one is holding. For the cash side, the 13-week cash flow forecast shows the lowest balance before the stock order leaves the account — both are in the Q4 Seller Pack.