Break-even ROAS: the one number every product needs before you spend a dollar on ads
ROAS is not profit. Learn how to calculate break-even ROAS and target ROAS per product from price, COGS, shipping and fees — with a worked example and a free formula.
Most ad dashboards celebrate a 3.0 ROAS. For some products that is a triumph. For others it is a slow way to go broke, because the product only leaves 25 cents of every revenue dollar after cost of goods, shipping and fees — and at 3.0 ROAS you are paying 33 cents per revenue dollar to get it. The campaign “works” and the bank balance falls.
The fix is not a better ad account. It is one number per product: the ROAS below which every sale loses money. That number is called break-even ROAS, and you can compute it in a minute with things you already know.
The formula
Start with contribution per unit: what one sale leaves after everything except advertising.
Contribution = price − COGS − shipping and packaging − platform and payment fees − refunds (as a share of price)
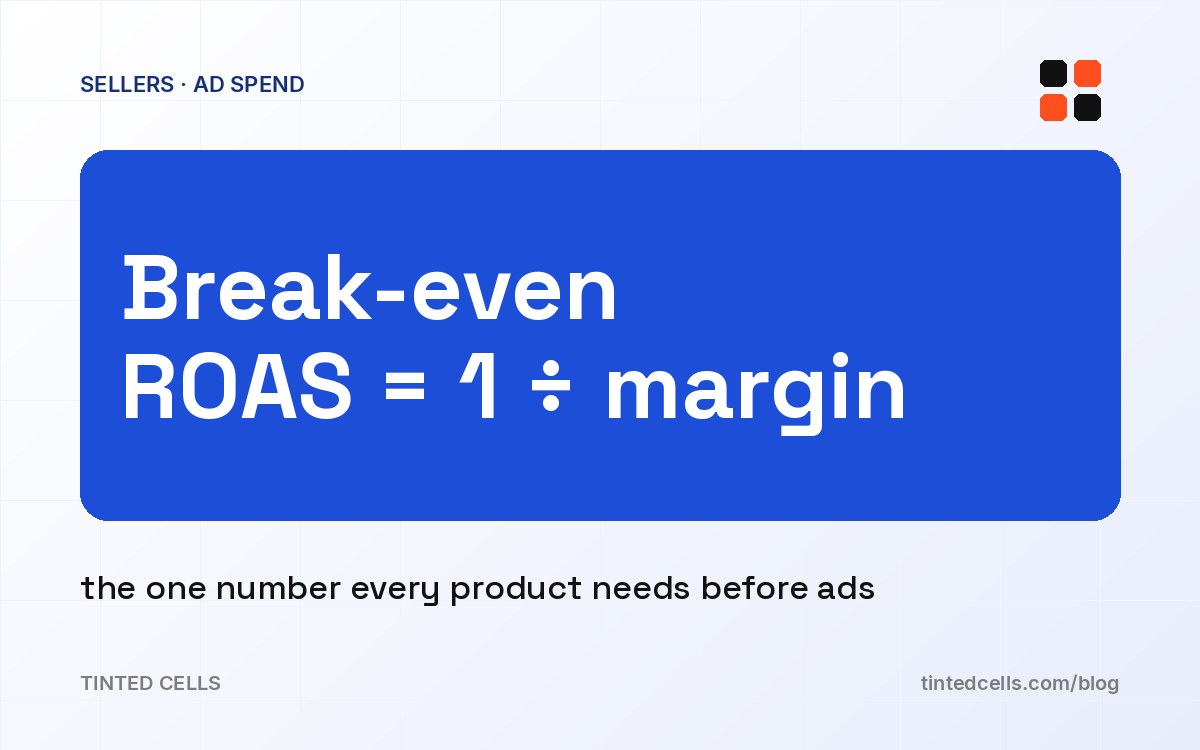
Break-even ROAS = price ÷ contribution
A $40 product with $12 COGS, $5 shipping, $2 in fees and a 4% refund rate has a contribution of $40 − 12 − 5 − 2 − 1.60 = $19.40. Its break-even ROAS is 40 ÷ 19.40 = 2.06. At 2.0 ROAS the campaign is losing money on every order, however healthy the number looks in the ad manager.
Now add the profit you actually want. If you need 10% of revenue left after ads, subtract that from the contribution first:
Target ROAS = price ÷ (contribution − price × target margin) = 40 ÷ (19.40 − 4) = 2.60
Between 2.06 and 2.60 the campaign covers its costs but does not earn your target. Above 2.60 it earns. Below 2.06 it burns. That is the whole framework: CUT, HOLD, SCALE.
Why one blended ROAS is not enough
Stores usually track a single account-level ROAS. But a catalogue is not one product. A $14 accessory with 60% contribution margin breaks even at 1.7 ROAS; a $129 product with $52 COGS and heavy shipping breaks even at 2.5. Run both under one campaign with one ROAS target and you will cut the accessory too early and keep the heavy product too long.
Assigning every campaign to the product it sells — or to a default margin when it sells many — lets you judge each campaign against its own break-even. The worst campaign in a “profitable” account is often hiding in plain sight.
Max CPA is the same number in different clothes
Some platforms optimise for cost per acquisition rather than ROAS. The conversion is simple: the most you can pay per order at your target is contribution minus target profit. For the product above that is 19.40 − 4 = $15.40. If the campaign’s CPA is above that, it is below target ROAS by definition.
Divide the max CPA by a realistic conversion rate and you get a max cost per click. At 2% conversion, $15.40 per order means about $0.31 per click. That is a useful sanity check before you touch bidding.
Three things that move the number
Refunds. A 4% refund rate barely matters at 60% margin and matters a lot at 30%. Track it per product, not per store.
Shipping. “Free shipping” is a cost you pay. Put the real average per order into the contribution, not the price you charge for it.
Fees. Marketplace fees of 10–15% change break-even ROAS more than most people expect. A product that works on your own store may not work on a marketplace at the same bid.
Turning it into a Monday habit
Knowing the number is the easy part. Using it every week is what changes the P&L. The routine that works: paste last week’s campaigns (spend, revenue, orders) next to the product each one sells; let each row get a verdict against that product’s break-even and target; pause the CUT rows, leave the HOLD rows alone, move budget to the SCALE rows in 20% steps; check the month’s spend against plan.
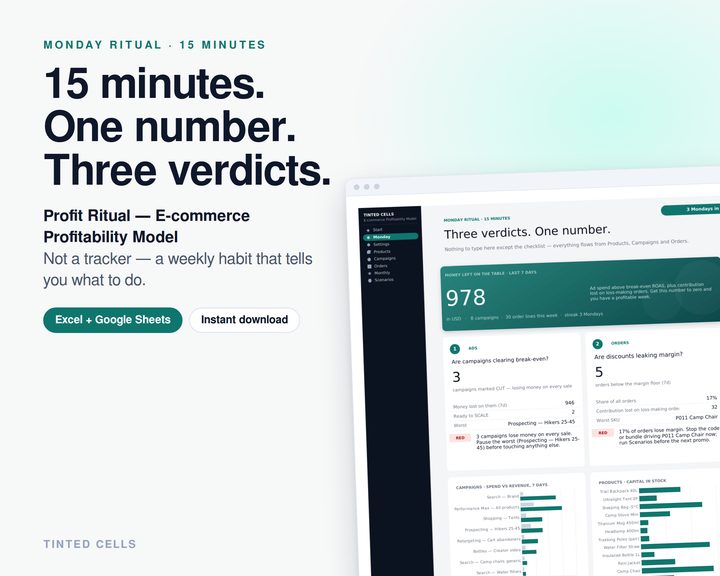
The Break-even ROAS & Ad Budget Planner in the Tinted Cells shop does exactly this in a spreadsheet: a Products sheet that computes break-even ROAS, target ROAS and max CPA per product; a Campaigns sheet that gives every pasted row a SCALE / HOLD / CUT verdict; a Budget sheet for the month; and a Monday page with one number — profit after ads — and three verdicts written as instructions. Excel and Google Sheets, sample data included.
Until then, the formula above and a calculator will get you further than any dashboard: price divided by contribution. Everything below it is a donation.