How much house can you actually afford? The 28/36 rule, the cash at closing and the number lenders skip
Lenders tell you what they will lend. This is how to work out what you can carry: the 28/36 rule, real monthly housing cost with taxes, insurance and PMI, and the cash you need at closing.
A pre-approval letter answers one question: how much a bank is willing to lend you. It does not answer the question you asked, which is how much house you can carry without the payment owning you. The two numbers are often $60,000–100,000 apart. Here is how to find yours.
The monthly cost is not the mortgage payment
Start with the payment on the loan — principal and interest at today’s rate over 30 years. Then add what everyone forgets to add until the first bill: property tax (typically 1–2% of the price per year, divided by twelve), home insurance, PMI if the down payment is under 20% (roughly 0.5–1% of the loan per year), and HOA dues if any. On a $420,000 home with 10% down at 6.25%, the loan payment is about $2,330 and the extras add another $750. The real monthly housing cost is $3,080, not $2,330.
The two lines: 28% and 36%
Lenders use two ratios, and they are decent guardrails even though a lender may stretch them for you.
Housing ratio: total monthly housing cost ÷ gross monthly income, ideally at or under 28%. Debt-to-income: housing plus every other monthly debt payment (car, student loans, cards) ÷ gross income, at or under 36%.
With $11,400 of gross monthly income and $640 of other debts, the $3,080 above is a 27% housing ratio and a 33% DTI — inside both lines, with little room. With $9,800 of income the same house is 31% and 38%, over both. A lender might still say yes. The lines say the payment will decide what you do with every other dollar for a decade.
Working backwards gives the useful number: the maximum housing cost your income allows is the smaller of 28% of income and 36% of income minus other debts. Subtract taxes, insurance and PMI, and what is left is the maximum loan payment — which converts, at today’s rate, into a maximum price. That price is what you can afford. Shop below it, not up to it.
Cash at closing is a separate test
Down payment plus closing costs (2–5% of the price) plus a buffer for moving, furniture and the repairs every inspection finds. On the $420,000 example at 10% down: $42,000 + $12,600 + $8,000 = about $62,600. And then the number nobody puts in the calculator: the safety net you keep after buying. Three months of living expenses still in the bank the day after closing is the difference between a house and a trap. Add it to the target.
Many homes that pass the payment test fail this one — the payment fits, the cash does not. It is a different problem with a different fix (time, or a smaller price), and it helps to know which one you have.
Months to go, at the pace you actually save
Divide what is still to save by what you have actually put aside per month over the last three months — not the plan, the pace. That gives a ready date. If it is later than the date you want, there are only three levers: move the date, lower the price, or raise the monthly amount. Automating the transfer on payday is the only reliable way to pull the third one.
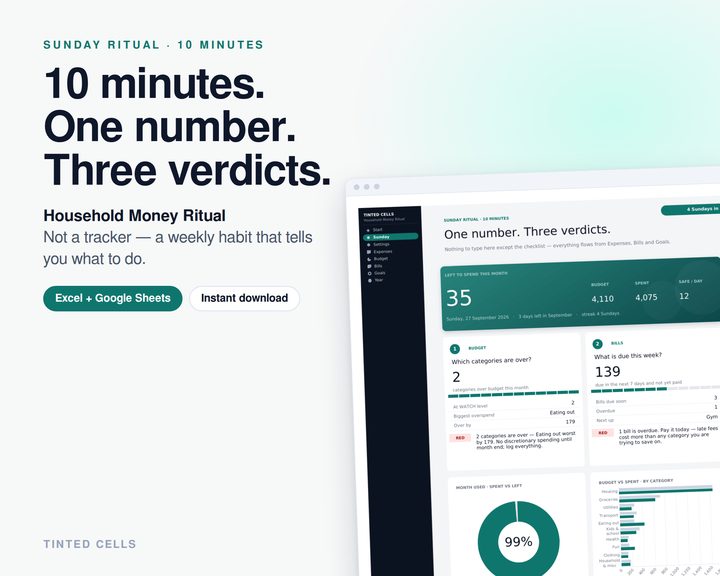
The Home Buyer Ritual spreadsheet runs all three tests from one Settings sheet: type target price, down payment, rate, income and debts, log the house-fund balance once a month, and add homes to a shortlist as you see them. Every home gets a monthly cost with taxes, insurance and PMI, both ratios, cash at closing, and a verdict — AFFORD, STRETCH or NO — and the monthly page shows months until you can buy at your real pace, with three verdicts on the down payment, affordability and the shortlist.
Find your maximum price before you look at a single listing. It is much harder to unsee a house than to compute a number.