Cash runway: how many months you actually have, and why 13 weeks beats 12
Learn to calculate cash runway correctly with net burn, why a 13-week forecast beats a 12-month one, and a worked example starting from $38,000.
“How many months of runway do we have” sounds like a simple division problem, and it is — cash divided by burn — but most people compute it wrong in a way that flatters the business. They take last month’s ending cash, divide by an average monthly expense figure pulled from the income statement, and get a number that feels stable right up until a big vendor payment or a slow payroll week blows a hole in it. Runway calculated from monthly averages is smooth. Cash in the real bank account is lumpy. The gap between those two views is where businesses run out of money with no warning.
Runway = cash ÷ net burn, done correctly
The formula itself is not the problem:
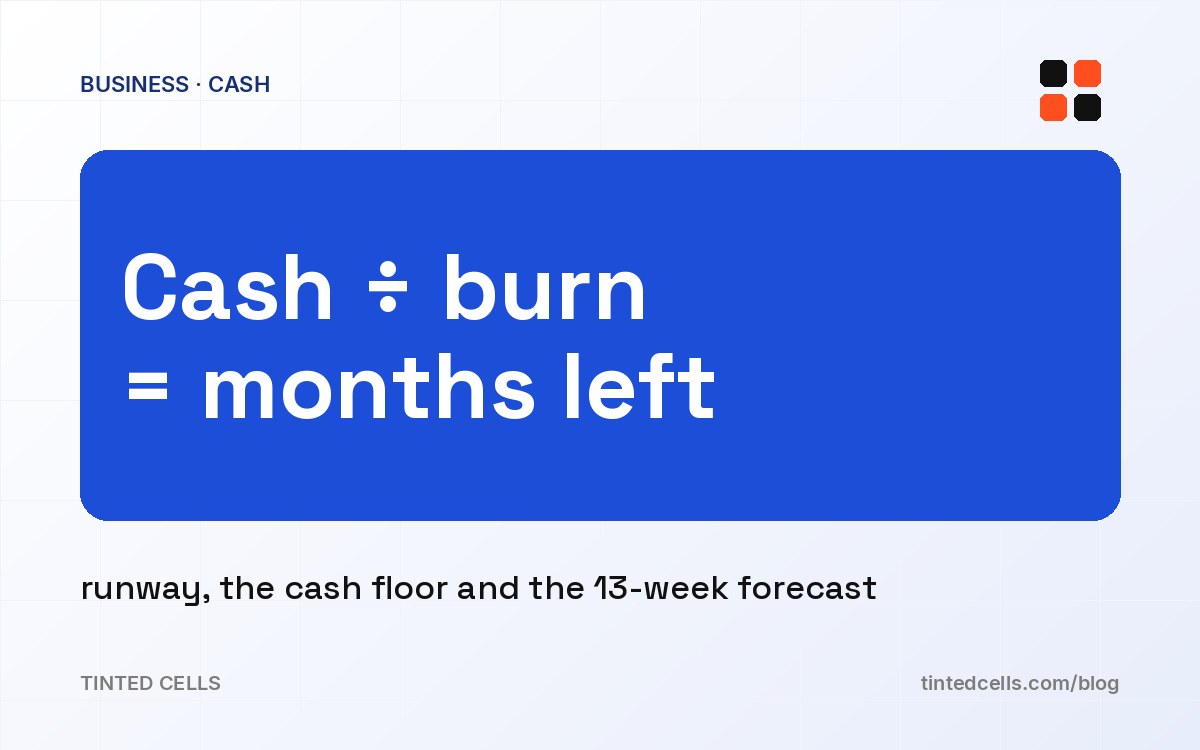
Runway (months) = current cash ÷ average monthly net burn
Net burn is cash out minus cash in, not the number on your P&L. A business can be “profitable” on paper — revenue exceeds expenses — and still burn cash every month because of unpaid invoices, inventory purchases, or a tax bill that hasn’t hit the income statement yet. Net burn has to come from the bank account and the receivables ledger, not the accounting software’s profit line.
Take a business with $38,000 in cash. Over the last three months it collected $61,000, $54,000, and $58,000, averaging $57,667 in receipts, and it spent $64,000, $61,000, and $66,000, averaging $63,667. Net burn is $63,667 − $57,667 = $6,000/month. Runway is $38,000 ÷ $6,000 = 6.3 months. That is the honest number — and it is already less comfortable than the “we made $2,000 profit last month” line most owners would quote from memory.
Why 13 weeks beats 12 months
A monthly average smooths over exactly the events that cause a cash crisis: payroll lands on specific days, not evenly across the month; a big client might pay 45 days late; a tax payment or an insurance renewal hits once a quarter, not as a steady monthly drip. A 13-week forecast — roughly one quarter, in weekly buckets — keeps every one of those lumps visible instead of averaging them away. Thirteen weeks is also long enough to see a real problem coming (a slow month, a big AR gap) while being short enough that the forecast stays accurate; a 12-month forecast built today is mostly guesswork by month eight.
Building one is not complicated, just disciplined. Each week gets four lines: expected receipts (invoices due, subscription renewals, expected new sales — discounted for the ones that always slip), payroll (including the exact dates, since payroll is rarely evenly spaced), rent and fixed overhead, and a tax set-aside (a percentage of receipts moved into “not really yours” money the moment it lands, so a quarterly tax bill never arrives as a surprise). Roll the ending balance of each week into the starting balance of the next, and you have a rolling 13-week picture instead of a monthly snapshot.
The cash floor
A cash floor is the minimum balance you decide the business should never go below — typically two to four weeks of fixed costs (payroll, rent, the tax set-aside), kept as a hard line rather than an aspiration. For the business above, if fixed costs (payroll plus rent) run $9,000/week, a three-week floor is $27,000. The useful version of a runway calculation isn’t “we hit zero in 6.3 months” — it’s “we hit the $27,000 floor in about 11 weeks,” because that is the point at which decisions (a credit line, a collections push, a spending freeze) need to already be made, not the point at which the account actually empties.
Worked forward: starting at $38,000 with net burn of $6,000/month (roughly $1,385/week), the account crosses the $27,000 floor after ($38,000 − $27,000) ÷ $1,385 ≈ 8 weeks — not the 6.3-month figure the monthly average implied, and not a coincidence that it is much sooner. The floor moves the warning earlier, which is the entire point of calculating it in the first place.
What changes the number week to week
A receipts forecast that assumes 100% of invoices get paid on time is fiction; a realistic forecast discounts expected receivables by a collection rate (if 85% of invoices historically arrive within terms, forecast 85%, not 100%). Payroll timing matters more than payroll total — two pay periods landing in the same week doubles that week’s outflow even though the monthly total is unchanged. And any one-time item — a tax payment, an annual software renewal, a big inventory order — needs its own line in the week it actually hits, not smeared across twelve months as if it were a steady cost.
Turning the math into a weekly habit
The 13-Week Cash Flow Forecast automates this whole routine: enter starting cash, expected receipts, payroll dates, fixed costs, and a tax set-aside percentage, and it rolls the balance forward week by week, flags the exact week you cross your cash floor, and updates automatically as actuals replace forecasts each Friday. Even without the sheet, the takeaway is this: runway is cash divided by net cash burn from the bank account, not the P&L — and the number that actually matters is not when you hit zero, it’s when you cross your floor, which usually arrives sooner than the monthly math suggests.