Rental property cash flow: the calculation that matters more than the purchase price
Calculate rental property net cash flow, cap rate, and cash-on-cash return with a worked $240,000 example, plus the 1% rule used correctly.
A property can look great on a listing — good rent, reasonable price, decent neighborhood — and still lose money every single month once the real costs are laid out. The purchase price and the advertised rent are two numbers out of many, and the only way to know if a deal actually works is to run the full cash flow calculation before making an offer, not after closing when the numbers are locked in.
Net cash flow: the formula
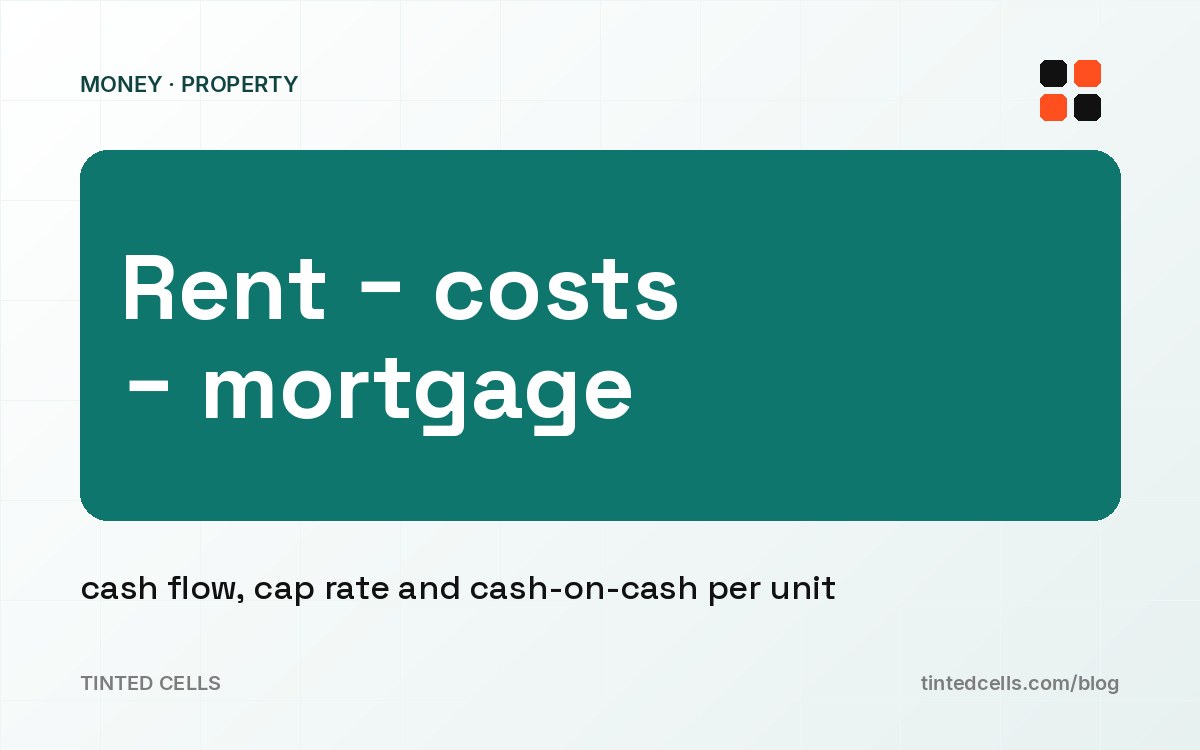
Net cash flow = rent − vacancy allowance − operating expenses − mortgage payment
Rent is the monthly amount charged. Vacancy allowance is a percentage of rent set aside for the months the unit sits empty between tenants — a common planning figure is 5–8% of rent, even in a market with low actual vacancy, because turnover, non-payment, and the occasional slow re-lease are normal, not exceptional. Operating expenses cover property tax, insurance, repairs and maintenance, and property management if used — each is a real monthly cost even when nothing breaks that particular month, because maintenance should be budgeted as an average, not skipped in the months nothing happens. Mortgage payment is principal and interest (and escrow, if the lender bundles tax and insurance into the payment — in which case don’t double-count them in operating expenses).
Cap rate and cash-on-cash: two different questions
Cap rate = net operating income (NOI) ÷ purchase price
NOI is rent minus vacancy minus operating expenses — before the mortgage payment. Cap rate answers a specific question: how does this property perform as an asset, independent of how it’s financed? It’s the number used to compare properties or compare a property to buying it in cash, and it ignores leverage entirely.
Cash-on-cash return = annual net cash flow ÷ total cash invested
Cash invested includes the down payment, closing costs, and any immediate repair costs to get the unit rent-ready — the actual cash that left the bank account, not the purchase price. Cash-on-cash answers a different question: given the financing actually used, what return is the invested cash earning? Two investors buying the identical property with different down payments will get the same cap rate and very different cash-on-cash returns, because leverage changes the second number and not the first.
A worked example
A property costs $240,000 and rents for $1,850 a month. Vacancy allowance at 6% of rent is $111. Operating expenses: property tax $280/month, insurance $95/month, repairs and maintenance budgeted at 8% of rent ($148/month), and no management company since the owner self-manages — total operating expenses of $523/month.
NOI (monthly) = 1,850 − 111 − 523 = $1,216. Annualized, NOI = $14,592.
Cap rate = 14,592 ÷ 240,000 = 6.08%.
Now bring in financing. Assume a 20% down payment ($48,000), closing costs of $6,000, and no immediate repairs needed — total cash invested of $54,000. Mortgage payment (principal and interest) on the $192,000 loan comes to $1,050/month at a typical rate for a 30-year term.
Net cash flow (monthly) = 1,216 − 1,050 = $166. Annualized, that’s $1,992.
Cash-on-cash return = 1,992 ÷ 54,000 = 3.69%.
Two very different numbers from the same property: a 6.08% cap rate that says the asset itself performs reasonably, and a 3.69% cash-on-cash return that says the actual cash invested, after financing, is earning less than that. Neither number is wrong — they answer different questions, and a buyer who only checks cap rate before closing might be surprised by how thin the actual monthly cash flow is once the mortgage payment is subtracted.
The 1% rule as a screen, not a decision
The 1% rule says monthly rent should be at least 1% of purchase price — for a $240,000 property, that’s $2,400 a month. This property rents for $1,850, well under the 1% threshold, and the 1% rule alone would have screened it out before a single number was calculated. But the full cash flow calculation above shows a property with positive, if modest, cash flow and a reasonable cap rate. The 1% rule is useful for quickly cutting a long list of listings down to the ones worth actually analyzing — it takes ten seconds per property and catches the obviously overpriced ones — but it should never be the reason to buy or pass on a specific property. It’s a filter for where to spend analysis time, not a substitute for the analysis.
Conversely, a property that clears the 1% rule can still be a bad deal if operating expenses are unusually high — old plumbing, a high tax jurisdiction, mandatory HOA fees — none of which the 1% rule accounts for at all. Screen with it, then always run the full calculation before an offer.
What to check on the first of each month
Once a property is owned, the calculation doesn’t stop mattering — it’s the monthly check that catches a slow leak before it becomes a real problem. On the first of each month: confirm rent was actually collected, not just invoiced; compare actual maintenance spend against the budgeted 8% (or whatever percentage was used) to catch a property that’s running hotter than planned; recheck vacancy — a unit that’s been empty two months in a row needs the allowance revisited, not just absorbed as bad luck; and recompute net cash flow with the real numbers for that month rather than the pro forma numbers from purchase day, because taxes, insurance premiums, and repair costs all drift upward over the years an original analysis never gets revisited.
Turning it into a routine
The Landlord Ritual automates this: enter rent, expenses, and financing per property and it computes NOI, cap rate, cash-on-cash return, and net cash flow automatically, with a monthly check-in page for tracking actual collected rent and expenses against the original plan across a whole portfolio. Even without the spreadsheet, the formula set stands on its own: net cash flow is rent minus vacancy minus operating expenses minus mortgage payment, cap rate is NOI divided by purchase price, and cash-on-cash return is annual net cash flow divided by actual cash invested — run all three before an offer, and recheck them every month after.